Testdata Analyzer
The DigiLab Testdata Analyzer provides powerful functional capabilities to mathematically interpret, explicitly filter, and natively compare massive graphical result curves dynamically over the web.
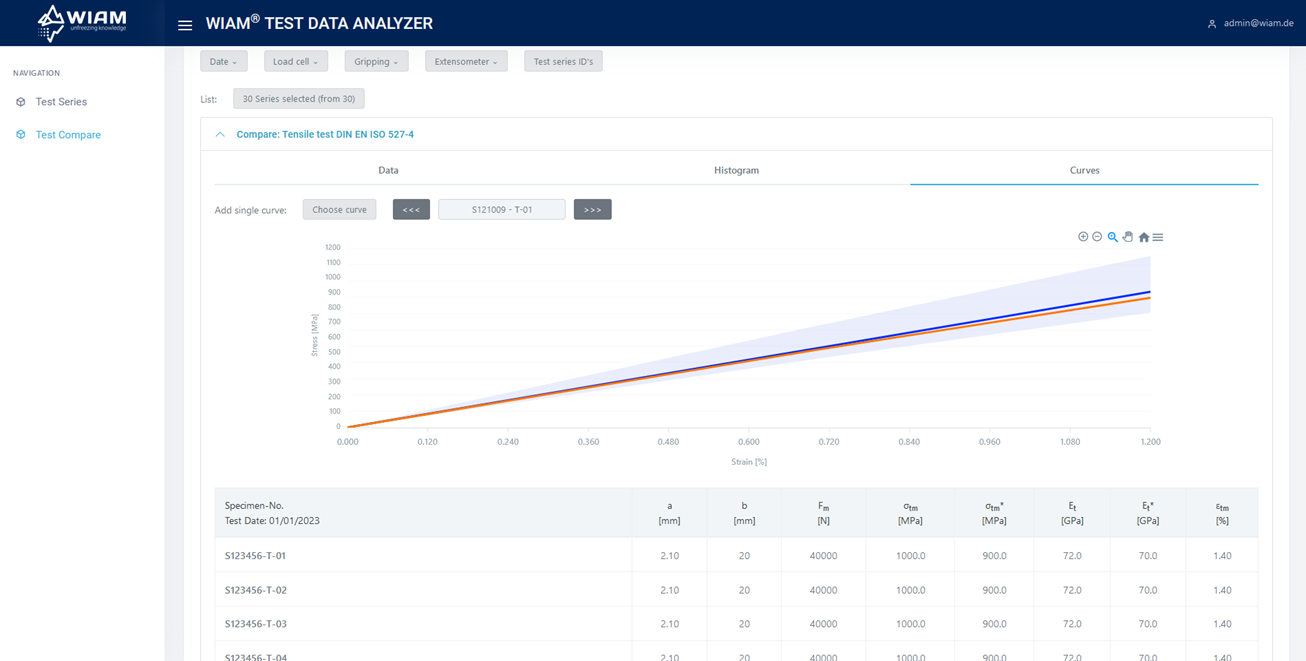
Single Curves Analysis
Exchanging raw test structures through native graphical contexts instantly isolates exact physical attributes.
Use Cases
- Physical Material Selection strictly mapped out derived from empirical stress testing.
- Capturing the Most Appropriate Vector specifically for rigorous CAD simulations.
Core Extraction Features: - Select and explicitly isolate singular dataset geometries. - Render curves entirely embedded inside standard deviation boundaries globally tracking Global Min, Global Max, and Average nodes. - Expose instantaneous macro-statistical bounds dynamically computed along the loaded target series.
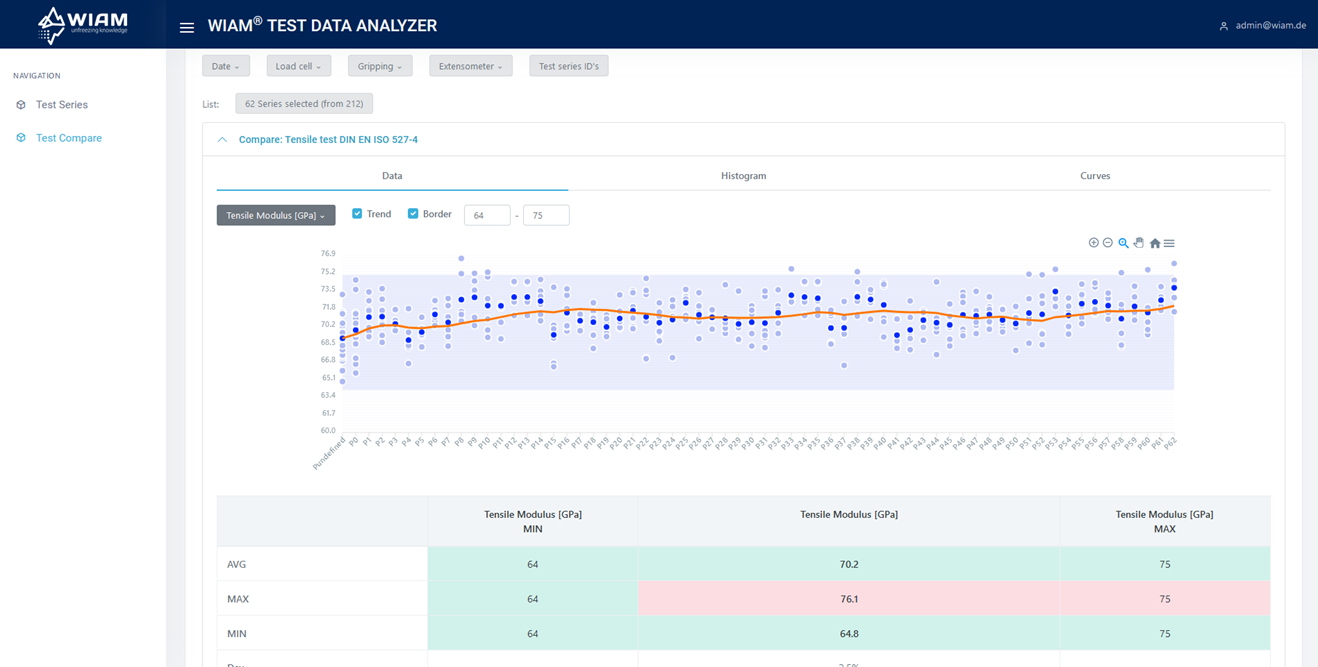
Dynamic Box Plot Comparisons
Render complex aggregate physical properties distinctly overlaying massive testing bounds across multiple hardware structures globally!
Use Cases
- Exact quantitative Incoming Goods Inspection.
- Natively verifying dynamic Manufacturing QA Tolerances.
Core Extraction Features:
- Target distinct properties utilizing heavy combinatorial maps: Dates, Equipment IDs, Explicit Serial Batches, or strictly manual injections.
- Compute average variance arrays specifically referencing discrete point boundaries.
- Render mathematically mapped Moving Average derivations adjacent natively.
- Trigger explicit visually-reactive Red Colorization Flags naturally highlighting broken boundary states!
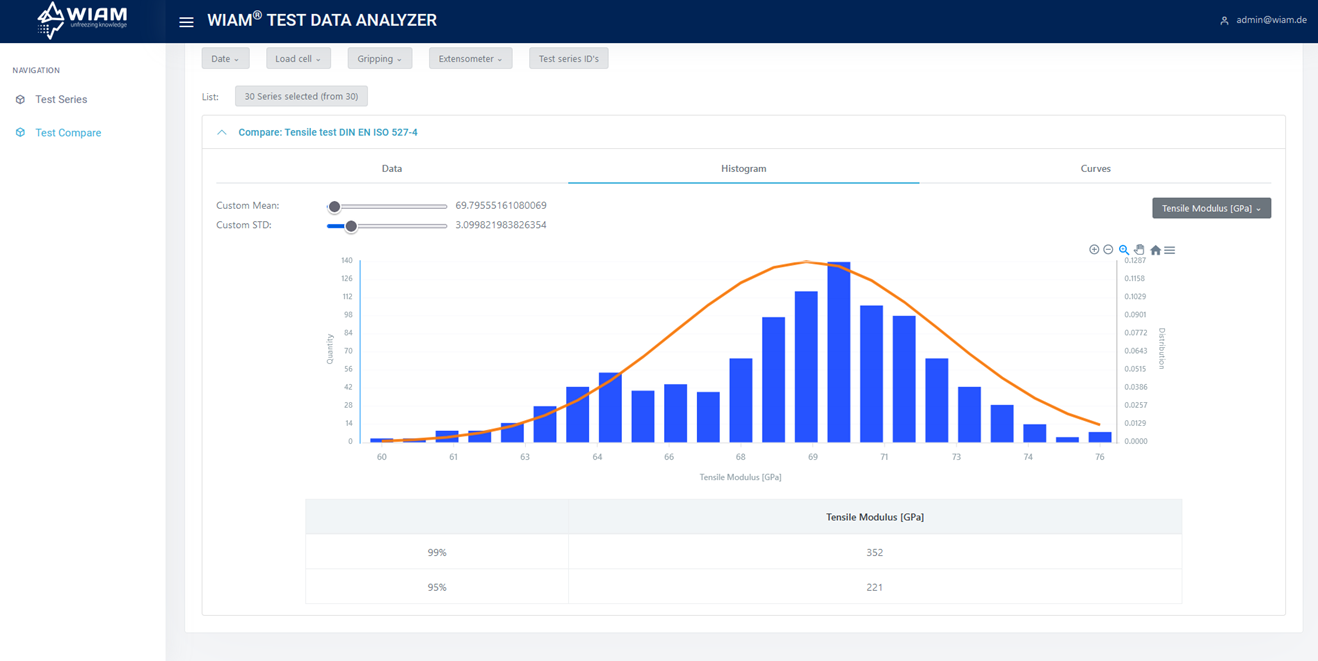
Component Histogram Parsing
Scale vast physical probability boundaries entirely inside robust density models rendering structural confidence ranges graphically!
Use Cases
- Establishing incredibly rigorous isolated Design Calculations for multi-faceted simulations.
- Scaling precise probabilistic matrices tracking global material performance bounds against market peers seamlessly.
Core Extraction Features: - Model empirical distribution maps utilizing complex test datasets accurately. - Extrapolate mathematical overlays organically wrapping identical data density vectors. - Spatially extract physical boundaries dynamically explicitly mapping strictly computed percentiles (95% & 99% constraints).